|
|
Post by prcgorman2 on Sept 20, 2022 16:41:59 GMT -5
I hope MNKD doesn't go below $3. I won't be able to withstand the temptation to add again.
|
|
|
|
Post by phdedieu12 on Sept 20, 2022 17:03:06 GMT -5
Ditto
|
|
|
|
Post by peppy on Sept 21, 2022 10:00:40 GMT -5
@ 1 and 1/2 hours of trade, MNKD volume at 1 million shares.
real time, 1,013,435 shares.
summary, 1,026,948
Avg. Volume 4,531,074
$3.295. -0.075. (-2.2255%)
|
|
|
|
Post by peppy on Sept 21, 2022 15:14:23 GMT -5
MNKD Nasdaq volume was 2 million two hours prior to the close at federal reserve interest rate announcement. MNKD Nasdaq real time volume, 4,729,568 shares MNKD Nasdaq summary volume, 4,895,319 Avg. Volume 4,531,074 $3.21. -0.16 (-4.7478%) Daily charts. $SPX and $COMPQ outside days. 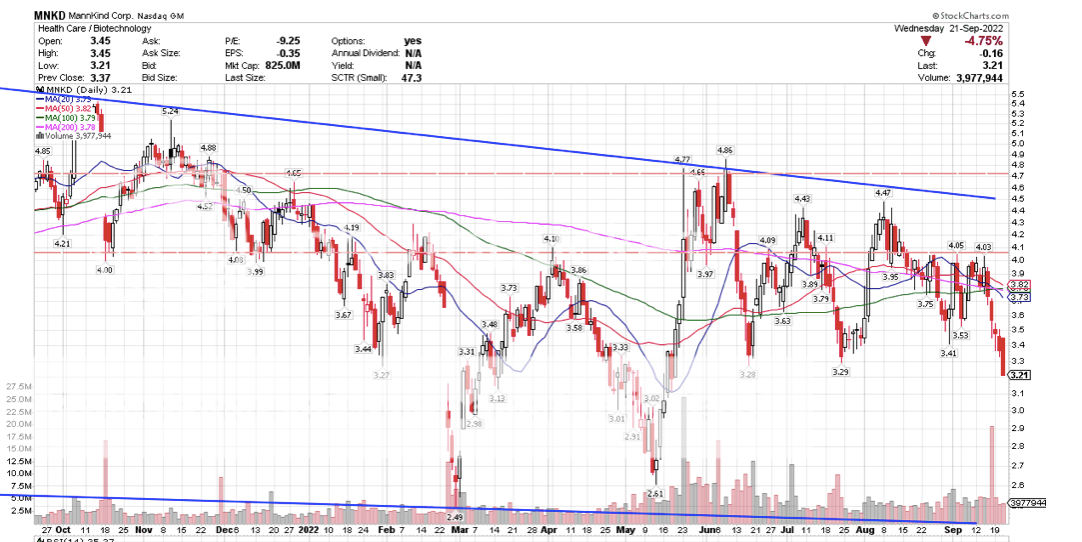 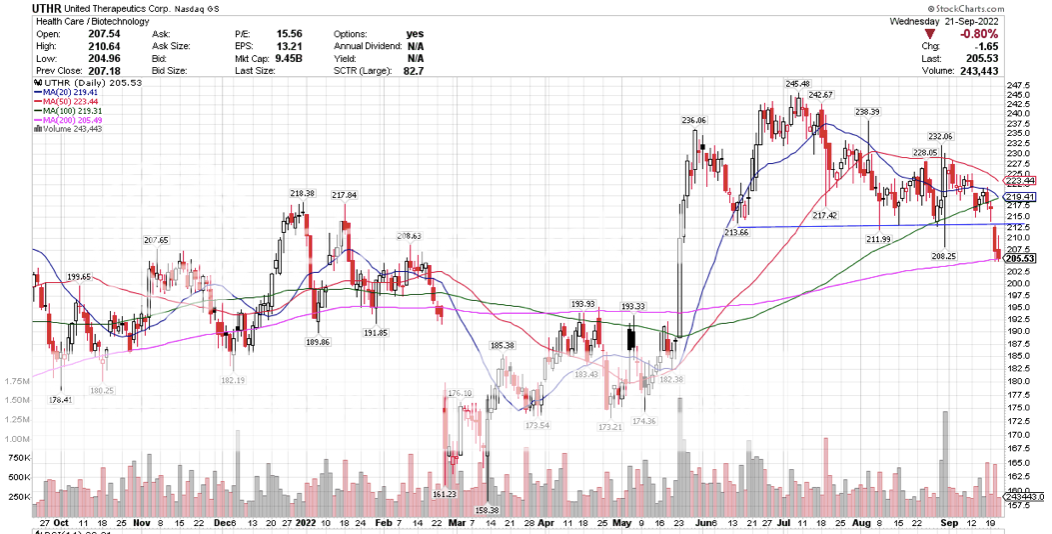 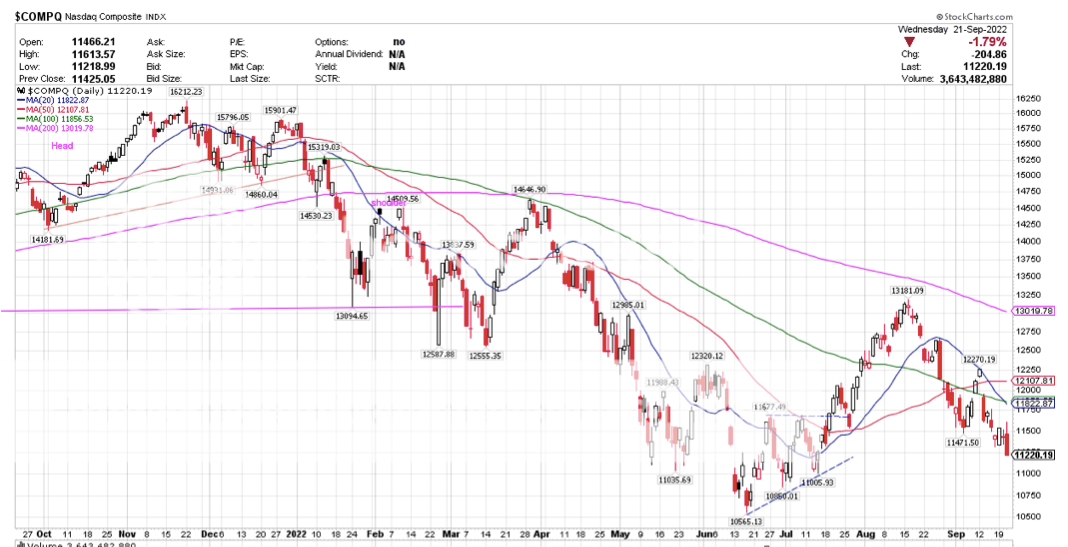 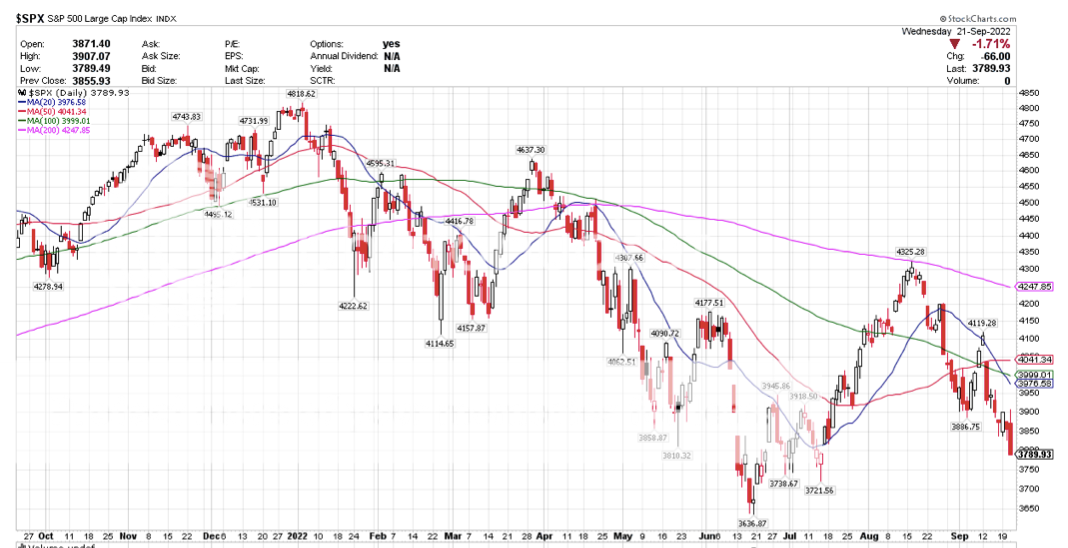 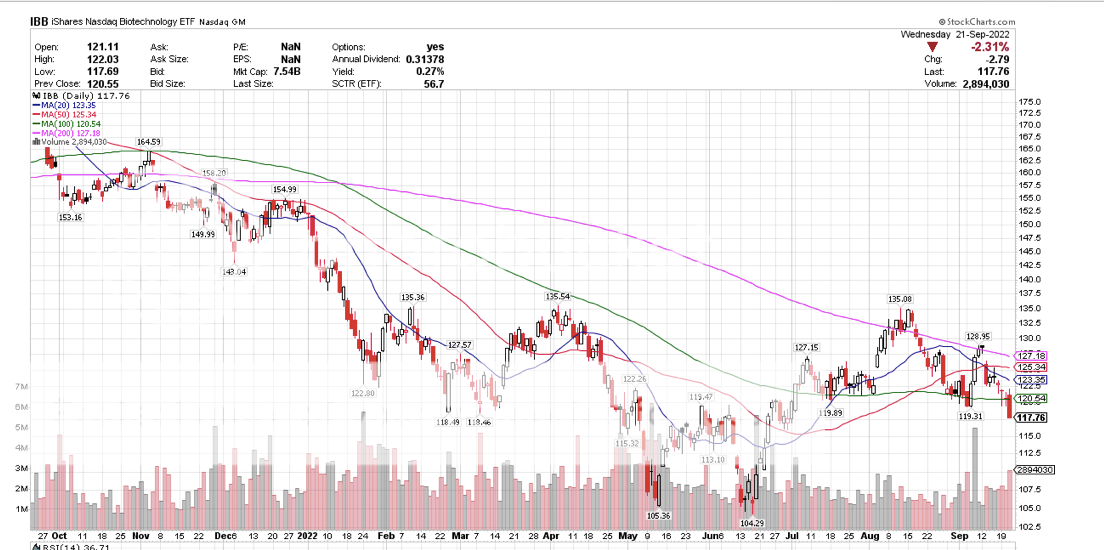 |
|
|
|
Post by mymann on Sept 21, 2022 15:57:41 GMT -5
Does the chart show how low the future target sp will be like it did for future target of 6,7,8 and 11 dollars sp?
|
|
|
|
Post by peppy on Sept 21, 2022 16:10:08 GMT -5
Does the chart show how low the future target sp will be like it did for future target of 6,7,8 and 11 dollars sp? Ask a smart ass question, get a smart ass answer? I and old fish tower, were typing on some thread. Thinking it through..... I have narrowed down the $COMPQ to bottom somewhere between 10,000 and 5,000. The $SPX somewhere between 3000 and 1500. The way I see it, dependent on whether or not the global world markets have a Sovereign debt crisis. What are you thinking? |
|
|
|
Post by peppy on Sept 22, 2022 9:01:58 GMT -5
MNKD Volume at 30 mins of trade,
real time, 526,596 shares.
summary, 530,048
Avg. Volume 4,567,622
$3.17. -0.04 (-1.2461%)
Nasdaq - 133, $SPX - 30
At 1 hour of trade,
real time, 940,913
summary, 977,107
Avg. Volume 4,567,622
$3.21. .00
Nasdaq - 128 $SPX -16
|
|
|
|
Post by buyitonsale on Sept 22, 2022 13:52:09 GMT -5
Added today at 3.13 , next GTC buy order at 2.93 .
|
|
|
|
Post by peppy on Sept 22, 2022 15:09:05 GMT -5
MNKD Volume at 30 mins of trade, real time, 526,596 shares. summary, 530,048 Avg. Volume 4,567,622 $3.17. -0.04 (-1.2461%) Nasdaq - 133, $SPX - 30 At 1 hour of trade, real time, 940,913 summary, 977,107 Avg. Volume 4,567,622 $3.21. .00 Nasdaq - 128 $SPX -16 MNKD Nasdaq real time volume, 4,708,923 MNKD Nasdaq summary volume, 4,659,373 $3.17. -0.04 (-1.25%) Chop. |
|
|
|
Post by peppy on Sept 23, 2022 9:02:15 GMT -5
MNKD Volume at 30 mins of trade, real time,' 377,243 summary, 378,943 Avg. Volume 4,545,760 3.1050-0.0650 (-2.0505%)  MNKD Volume at 1 hour of trade, real time, 655,352 summary, 712,439 $3.115. -0.055. (-1.74%) As of 10:30AM EDT. Market open. |
|
|
|
Post by stockwhisperer on Sept 23, 2022 9:39:25 GMT -5
I realize this is from the total train wreck in the markets but does anyone have a guess as to - around what sp MNKD will land at before turning back up? I would guess we have to be close.
|
|
|
|
Post by prcgorman2 on Sept 23, 2022 10:28:42 GMT -5
I realize this is from the total train wreck in the markets but does anyone have a guess as to - around what sp MNKD will land at before turning back up? I would guess we have to be close. Ooh, no disrespect but not taking that bet. Check out Peppy's thread on "Change of Trend". The world's markets are looking more and more like 2008 if not 1929. |
|
|
|
Post by radgray68 on Sept 23, 2022 12:50:22 GMT -5
Unfortunately, the trend is not our friend. The charts aren't giving me/us any love and the fed seems determined to interfere until they break something.......as they do.
Question, though, for those with the mad skills: Any of you guys build a chart of Mannkind's EBITDA over time? Might be a more accurate measure of where we're going price wise as we achieve profitability. I'm not going to go through years of past 10K's but I am going to try to pay attention to it starting with the first full quarter's numbers in November. Just wondered if there were any already available as I'm going to have to do it with graphing paper, and pencil (yes I'm that primitive but I enjoy the exercise)
Warning: my quick visual mathematics tell me $2.00 might be achievable again if markets go 2008 or even sub $1.00 if we go 1929.
Peppy, please tell me your charts say that's impossible.
|
|
|
|
Post by hellodolly on Sept 23, 2022 13:01:06 GMT -5
Unfortunately, the trend is not our friend. The charts aren't giving me/us any love and the fed seems determined to interfere until they break something.......as they do. Question, though, for those with the mad skills: Any of you guys build a chart of Mannkind's EBITDA over time? Might be a more accurate measure of where we're going price wise as we achieve profitability. I'm not going to go through years of past 10K's but I am going to try to pay attention to it starting with the first full quarter's numbers in November. Just wondered if there were any already available as I'm going to have to do it with graphing paper, and pencil (yes I'm that primitive but I enjoy the exercise) Warning: my quick visual mathematics tell me $2.00 might be achievable again if markets go 2008 or even sub $1.00 if we go 1929. Peppy, please tell me your charts say that's impossible. Might be an idea for you to start a new thread??? |
|
|
|
Post by mytakeonit on Sept 23, 2022 13:09:18 GMT -5
peppy said that it isn't possible. MNKD wasn't around in 1929 ...
But, that's mytakeonit
|
|