|
|
Post by peppy on Oct 14, 2022 16:04:51 GMT -5
Quiet Board. Since MNKD turned positive in the moment, Volume at half day of trade, real time, 1,184,738 shares. summary, 1,184,938 Avg. Volume 4,535,271 $3.125. +0.005. (+0.1603%) $SPX down 55 $COMPQ down 213. MNKD Nasdaq real time volume, 3,393,698 shares. MNKD Nasdaq summary volume, 3,359,307 Avg. Volume 4,535,271 $3.06. -0.06 (-1.92%) 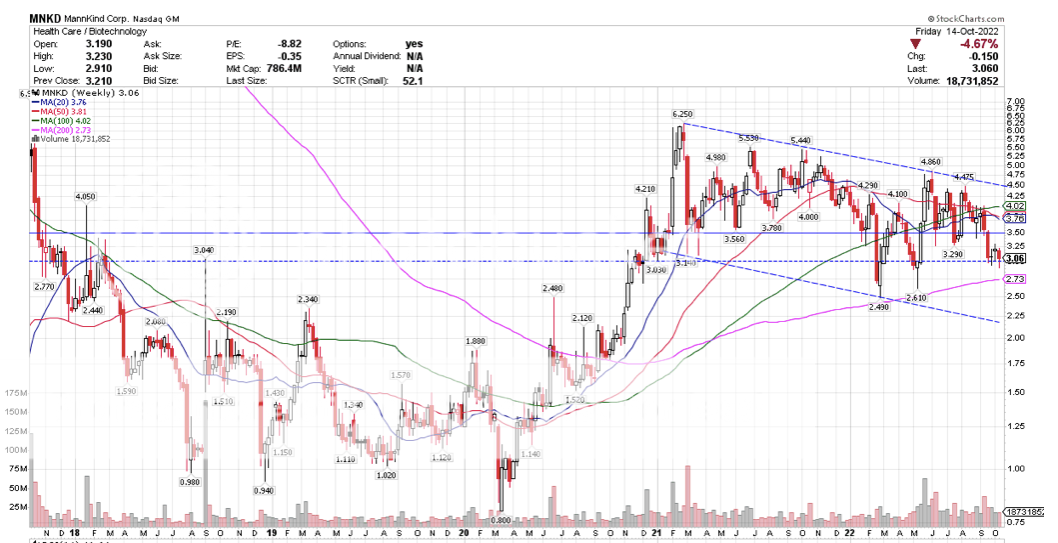 $COMPQ price below its 200 week. 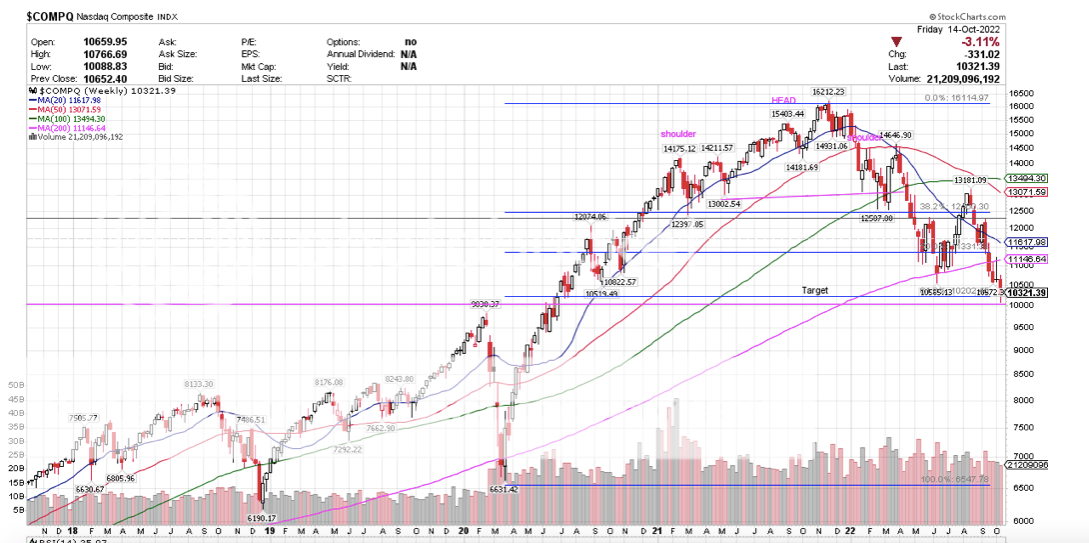 $SPX price on its 200 week MA. 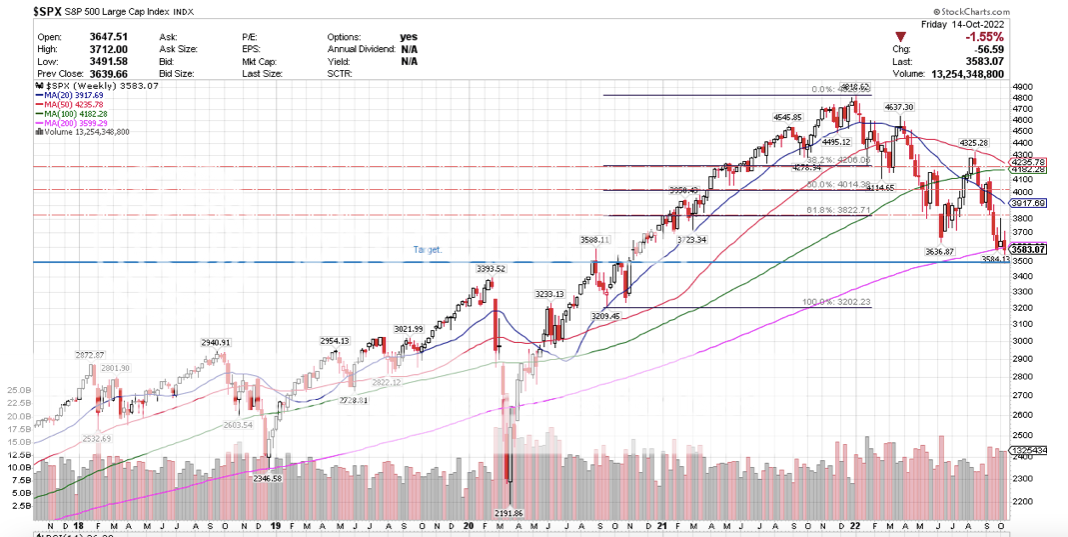 UTHR holding its 50 week. 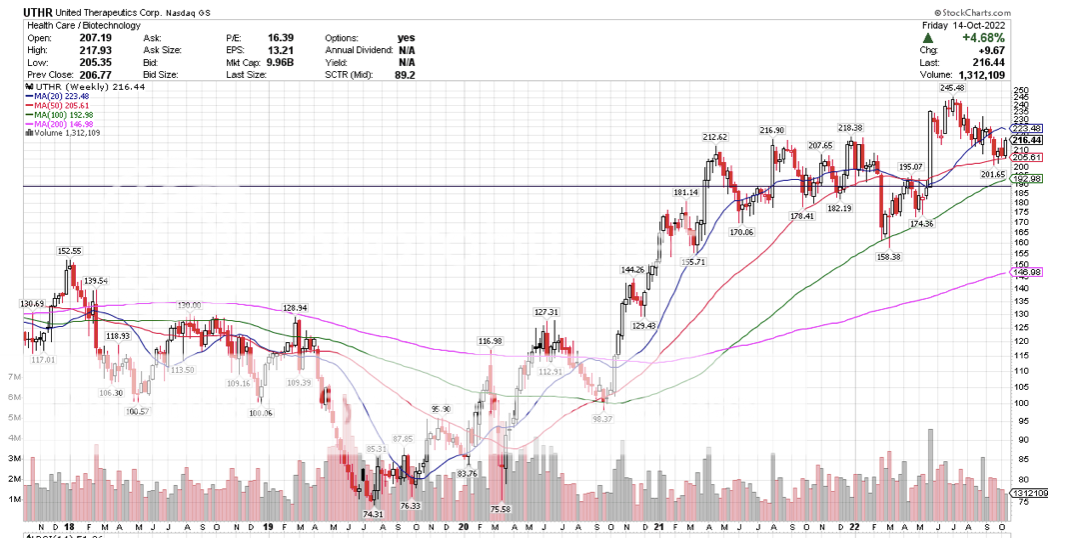 |
|
|
|
Post by peppy on Oct 17, 2022 9:31:53 GMT -5
Low volume for MNKD, MNKD is just going with the flow,.
MNKD volume at 1 hour of trade,
real time, 305,432 shares.
Summary, 310,632
Avg. Volume 4,534,701
$3.1901. +0.1301 (+4.2516%)
As of 10:30AM EDT. Market open.
At 1 and 1/2 hours of trade,
real time, 528,377
Summary, 528,377
$3.195. +0.135. (+4.41%)
The overall market pulling back from the gap open.
|
|
|
|
Post by peppy on Oct 17, 2022 15:18:03 GMT -5
|
|
|
|
Post by Chris-C on Oct 17, 2022 15:51:49 GMT -5
|
|
|
|
Post by cedafuntennis on Oct 18, 2022 10:38:59 GMT -5
That is awesome and spot on. Rubber ball. Bouncy Bouncy
|
|
|
|
Post by peppy on Oct 18, 2022 16:15:31 GMT -5
MNKD Nasdaq real time volume, 3,071,937 shares. MNKD Nasdaq summary volume, 2,872,401 Avg. Volume 4,551,932 $3.35. +0.08 (+2.45%) 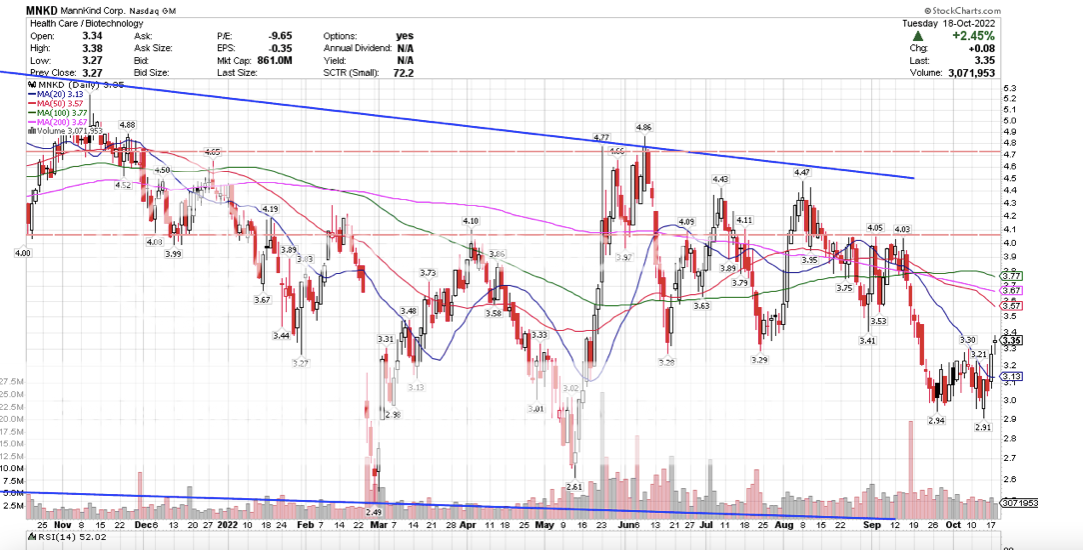 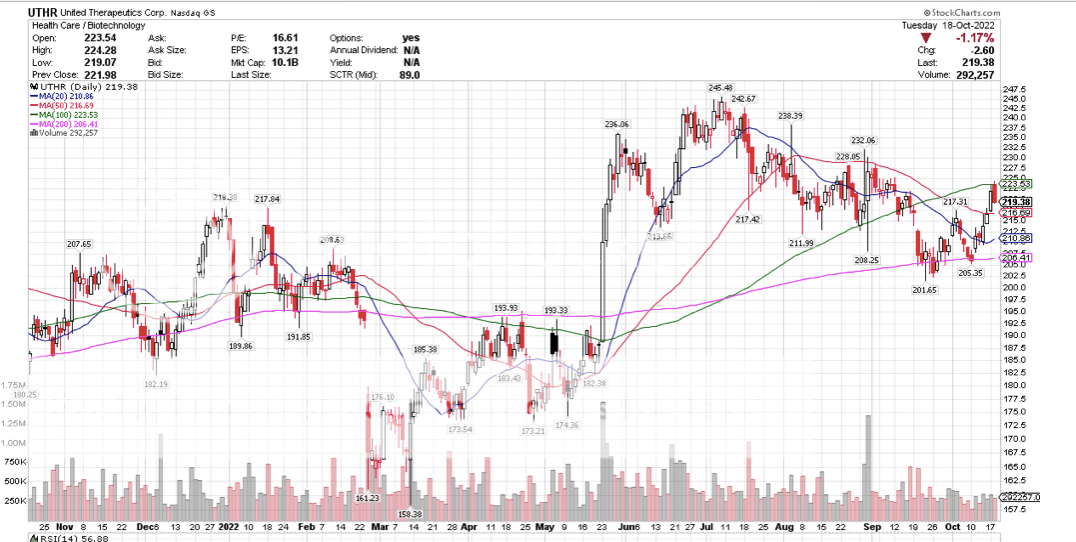 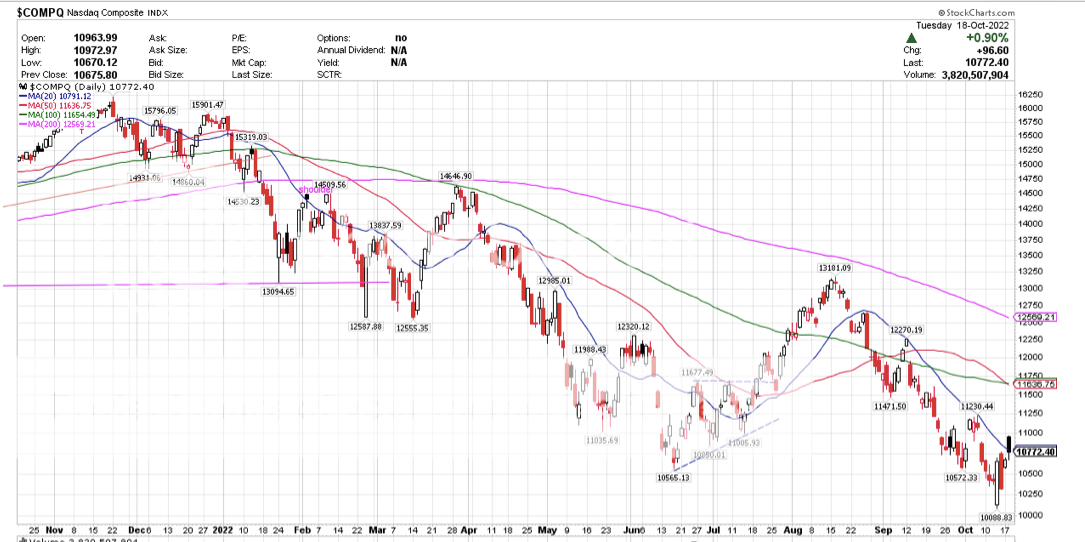 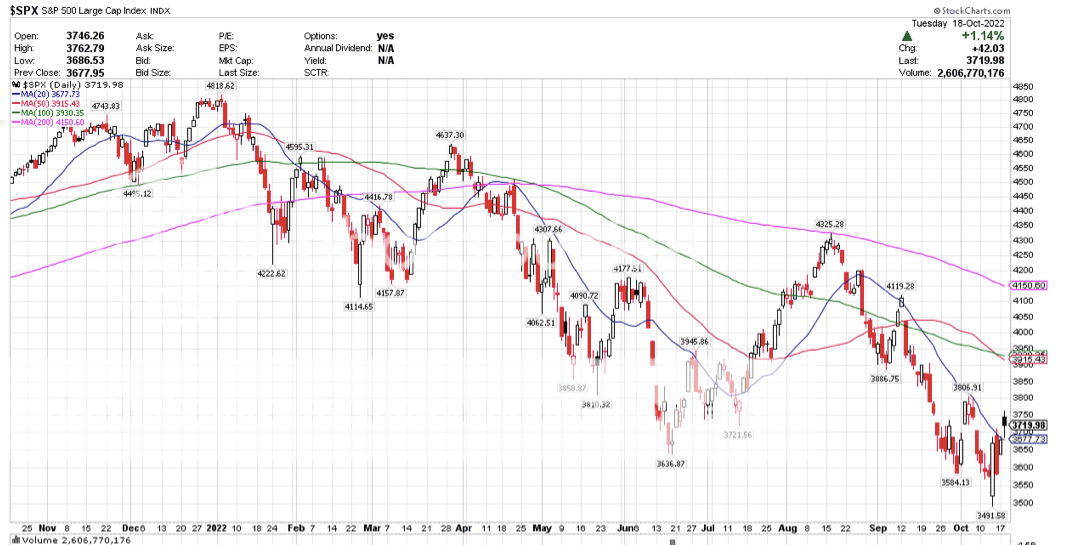 |
|
|
|
Post by runner on Oct 18, 2022 19:42:28 GMT -5
I'd like to see us bounce back to over $4.50 by the end of the year and then bounce to $5 in Q1.
Peppy's bouncy charts will show us the way!
|
|
|
|
Post by prcgorman2 on Oct 18, 2022 20:16:17 GMT -5
Fed interest rate hike coming week after next. Don’t hold your breath on the market staging anything but rallies on the way to the bottom.
|
|
|
|
Post by RainbowUnicorn on Oct 18, 2022 22:45:23 GMT -5
News & Events:MNKD
MANNKIND CORP
3.35Up 0.08 (2.4465 %)as of 4:00:00pm ET 10/18/2022
Technical Event
Mannkind Corp forms bullish "Double Bottom" chart pattern
10/18/2022
Recognia has detected a "Double Bottom" chart pattern formed on Mannkind Corp (MNKD on NASDAQ). This bullish signal indicates that the price may rise from the close of 3.35 to the range of 3.65 - 3.73. The pattern formed over 19 days which is roughly the period of time in which the target price range may be achieved.
Mannkind Corp has a current support price of 3.21 and a resistance level of 3.57.
A Double Bottom is considered a bullish signal, indicating a possible reversal of the current downtrend to a new uptrend. Sometimes called a "W" formation because of the pattern it creates on the chart, a Double Bottom consists of two well-defined, sharp troughs at approximately the same price level. The technical event occurs when prices break out above the highest high of the formation, which confirms the pattern.
|
|
|
|
Post by runner on Oct 18, 2022 23:35:38 GMT -5
Peppy, What does your bouncy bottom say about this?
|
|
|
|
Post by peppy on Oct 19, 2022 0:42:30 GMT -5
Peppy, What does your bouncy bottom say about this? Blah blah blah is what I think. These guys use words Recognia has detected a "Double Bottom" chart pattern ( Where?) formed on Mannkind Corp (MNKD on NASDAQ). This bullish signal indicates that the price may rise from the close of 3.35 to the range of 3.65 - 3.73. ( CHOP) The pattern formed over 19 days which is roughly the period of time in which the target price range may be achieved. Mannkind Corp has a current support price of 3.21 and a resistance level of 3.57. ( Still chop)A Double Bottom is considered a bullish signal, indicating a possible reversal of the current downtrend to a new uptrend. Sometimes called a "W" formation because of the pattern it creates on the chart, a Double Bottom consists of two well-defined, sharp troughs at approximately the same price level. The technical event occurs when prices break out above the highest high of the formation, which confirms the pattern. Meaningless mumbo jumbo. Call me cranky pants.MNKD Still holding stronger than the overall US market as in $COMPQ and $SPX ![]() 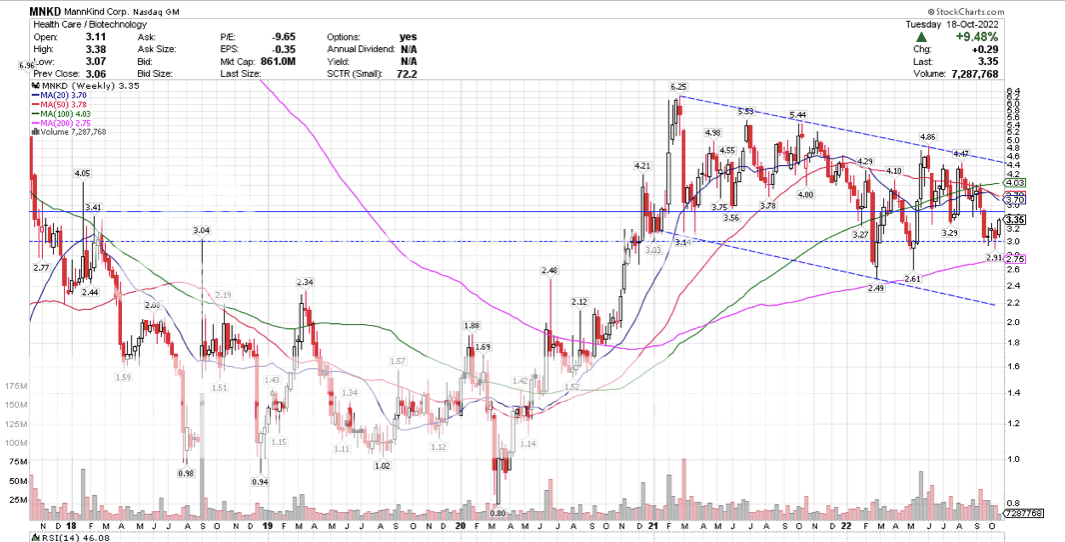 $COMPQ looks like another bear flag is forming. We will see how far it gets. 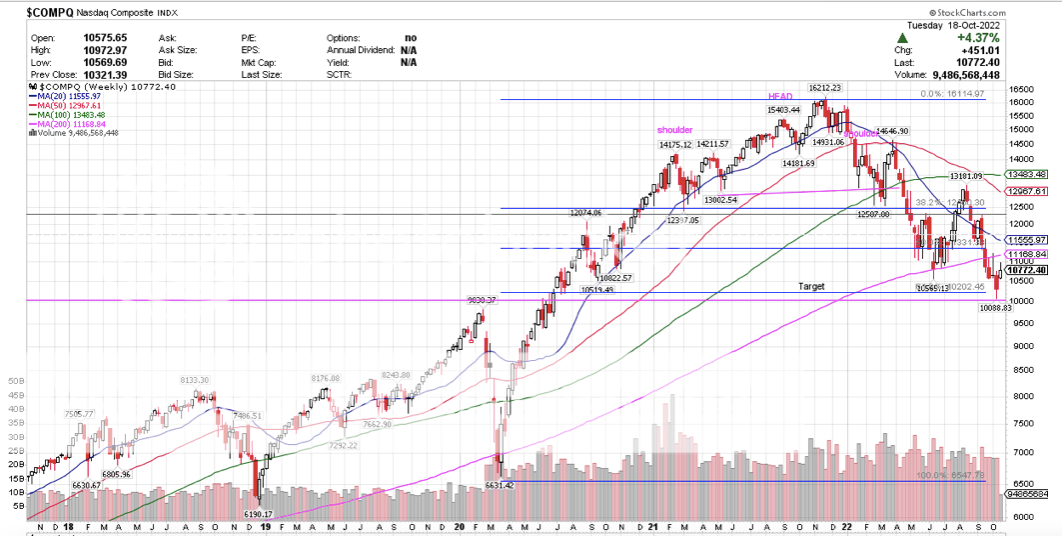 |
|
|
|
Post by akemp3000 on Oct 19, 2022 7:22:52 GMT -5
I seriously enjoy the education provided by chart readers. That said, it seems the coming weeks are simply going to follow the same path as previously; move up as we get closer to the unknown 3Q earnings report in early November. Then, it's anybody's guess since it will be the first full quarter with UTHR revenues being reported along with some deferred revenues remain blah, blah, blah. Oh, and be sure to take into account an important election in the midst. GL
|
|
|
|
Post by RainbowUnicorn on Oct 19, 2022 14:24:58 GMT -5
News & Events:MNKD MANNKIND CORP 3.35Up 0.08 (2.4465 %)as of 4:00:00pm ET 10/18/2022 Technical Event Mannkind Corp forms bullish "Double Bottom" chart pattern 10/18/2022 Recognia has detected a "Double Bottom" chart pattern formed on Mannkind Corp (MNKD on NASDAQ). This bullish signal indicates that the price may rise from the close of 3.35 to the range of 3.65 - 3.73. The pattern formed over 19 days which is roughly the period of time in which the target price range may be achieved. Mannkind Corp has a current support price of 3.21 and a resistance level of 3.57. A Double Bottom is considered a bullish signal, indicating a possible reversal of the current downtrend to a new uptrend. Sometimes called a "W" formation because of the pattern it creates on the chart, a Double Bottom consists of two well-defined, sharp troughs at approximately the same price level. The technical event occurs when prices break out above the highest high of the formation, which confirms the pattern.  |
|
|
|
Post by peppy on Oct 19, 2022 14:29:47 GMT -5
News & Events:MNKD MANNKIND CORP 3.35Up 0.08 (2.4465 %)as of 4:00:00pm ET 10/18/2022 Technical Event Mannkind Corp forms bullish "Double Bottom" chart pattern 10/18/2022 Recognia has detected a "Double Bottom" chart pattern formed on Mannkind Corp (MNKD on NASDAQ). This bullish signal indicates that the price may rise from the close of 3.35 to the range of 3.65 - 3.73. The pattern formed over 19 days which is roughly the period of time in which the target price range may be achieved. Mannkind Corp has a current support price of 3.21 and a resistance level of 3.57. A Double Bottom is considered a bullish signal, indicating a possible reversal of the current downtrend to a new uptrend. Sometimes called a "W" formation because of the pattern it creates on the chart, a Double Bottom consists of two well-defined, sharp troughs at approximately the same price level. The technical event occurs when prices break out above the highest high of the formation, which confirms the pattern.  Using a microscope, the article was wrong regarding the price behavior, including support. |
|
|
|
Post by boytroy88 on Oct 19, 2022 14:55:56 GMT -5
Well, it did go above the "head" so it wasn't wrong in that regard. The SP just couldn't sustain the positive momentum... Maybe time to buy more... Especially if it dips before 3 again.
|
|